Windmill Upon Hills Operating Hour and Contact Details:
Monday – Friday: 9:00 AM – 5:00 PM
Saturday: 9:00 AM – 1:00PM
Sunday & Public Holidays: Closed
Tel: 03-9213 0709
Email: windmilluponhill.mgmt@gmail.com


REAP WHAT YOU SOW
Windmill Upon Hills Operating Hour and Contact Details:
Monday – Friday: 9:00 AM – 5:00 PM
Saturday: 9:00 AM – 1:00PM
Sunday & Public Holidays: Closed
Tel: 03-9213 0709
Email: windmilluponhill.mgmt@gmail.com


James – 011 3245 9299
| Completion Date | from Y2001* |
| Launch Price | from RM80k* |
| Subsale Price | RM330k per unit RM383 psqft (median price as of Y2018) |
| Asking Rental Price | from RM900 - RM1,400 per month |
| Maintenance & Sinking Fund | RM55 per month |
| Assessment Rate (Cukai Pintu) | RM129.60 x 2 = RM259.20 per year |
| Quit Rent (Cukai Petak) | ? |
| Fire Insurance | RM70 per year |
| Built Up | from 850 sqft |
| Land Title | Residential |
| Tenure | Leasehold |
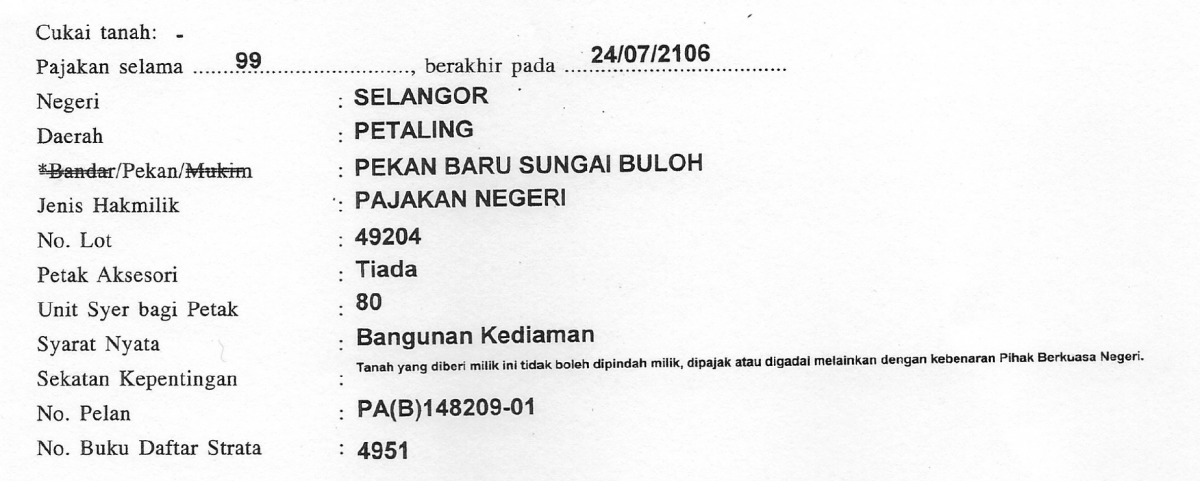
| Tenure Expiry | 24/07/2106 |
| Total Blocks | 4 |
| Total Storey | 5 |
| Total Units | 400 |
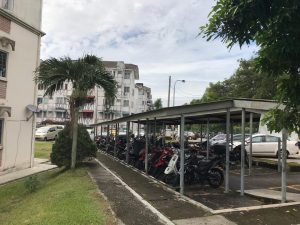
| Parking per unit | Min. 1 |
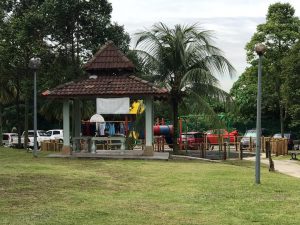
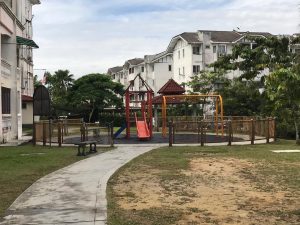
| Facilities | Playground & multi purpose hall |


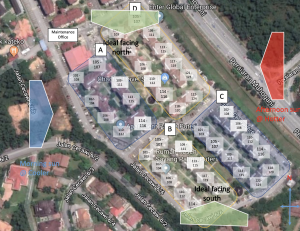
Address:
Jalan Cecawi 6/6,
Section 6, Kota Damansara,
47810 Petaling Jaya, Selangor

As of July 2019, average asking price is RM285,000 and average asking rental is RM1,100. (Based on mudah.my)
If take loan of 30 years with 4.5% interest and 10% downpayment, loan installment is RM1,300.
So if buy this property it is negative cash flow of RM200 per month. If include maintenance cost, quit rent and cukai petak, the loss is much higher.
The purchased price for this property is RM240,000 to have break even vs asking rental (only includes loan installment cost).
For Year 2018, the median transacted price is RM330,000.

I compiled the property transaction by year and subsector for time being is only for residential as I personally only invest in residential property.
Data source is from JPPH.
| Year | Volume of Transaction ('000) | Change in Volume of Transaction (%) year on year | Value RM(billion) | Change in Value (%) year on year |
|---|---|---|---|---|
| 1990 | 148.20 | N/A | 15.16 | N/A |
| 1991 | 164.00 | 10.7 | 17.32 | 14.2 |
| 1992 | 168.27 | 2.6 | 20.27 | 17.0 |
| 1993 | 178.05 | 5.8 | 22.44 | 10.7 |
| 1994 | 217.54 | 22.2 | 29.70 | 32.4 |
| 1995 | 251.89 | 15.8 | 39.85 | 34.2 |
| 1996 | 270.53 | 7.4 | 48.99 | 22.9 |
| 1997 | 274.75 | 1.6 | 53.21 | 8.6 |
| 1998 | 186.08 | -32.3 | 27.90 | -47.6 |
| 1999 | 225.89 | 21.4 | 34.42 | 23.4 |
| 2000 | 240.06 | 6.3 | 41.31 | 20.0 |
| 2001 | 242.63 | 1.1 | 38.63 | -6.5 |
| 2002 | 231.39 | -4.6 | 38.64 | 0.0 |
| 2003 | 243.38 | 5.2 | 43.43 | 12.4 |
| 2004 | 293.21 | 20.5 | 59.96 | 38.1 |
| 2005 | 276.51 | -5.7 | 56.78 | -5.3 |
| 2006 | 283.90 | 2.7 | 61.60 | 8.5 |
| 2007 | 309.46 | 9.0 | 77.14 | 25.2 |
| 2008 | 340.24 | 9.9 | 88.34 | 14.5 |
| 2009 | 337.86 | -0.6 | 81.00 | -8.3 |
| 2010 | 376.59 | 11.4 | 107.44 | 32.6 |
| 2011 | 430.40 | 14.3 | 137.83 | 28.3 |
| 2012 | 427.52 | -0.7 | 142.84 | 3.6 |
| 2013 | 381.13 | -10.9 | 152.37 | 6.7 |
| 2014 | 384.06 | 0.8 | 162.97 | 7.0 |
| 2015 | 362.11 | -5.7 | 149.90 | -8.0 |
| 2016 | 320.43 | -11.5 | 145.41 | -3.0 |
| 2017 | 311.82 | -2.7 | 139.84 | -3.8 |
| 2018 | 313.71 | 0.6 | 140.33 | 0.3 |
| Year | Volume | Value RM(million) |
|---|---|---|
| 2001 | 176,208 | 22,199.2 |
| 2002 | 162,269 | 21,136.7 |
| 2003 | 164,723 | 23,011.2 |
| 2004 | 195,243 | 29,295.8 |
| 2005 | 181,762 | 28,407.3 |
| 2006 | 182,555 | 29,446.9 |
| 2007 | 199,482 | 36,490.6 |
| 2008 | 216,702 | 41,304.0 |
| 2009 | 211,653 | 41,848.4 |
| 2010 | 226,874 | 50,654.2 |
| 2011 | 269,789 | 61,831.6 |
| 2012 | 272,669 | 67,762.2 |
| 2013 | 246,225 | 72,060.4 |
| 2014 | 247,251 | 82,059.6 |
| 2015 | 235,967 | 73,469.9 |
| 2016 | 203,064 | 65,574.43 |
| 2017 | 194,684 | 68,463.23 |
| 2018 | 197,385 | 68,748.26 |
Residential Property Overhang for Year 2018 categorized by type of property and value.
| Price Range (RM) | Units | Value RM(million) |
|---|---|---|
| Below RM200,000 | 4,692 | 570.02 |
| RM201,000 - RM300,000 | 7,566 | 1,829.21 |
| RM301,000 - RM500,000 | 7,517 | 2,915.25 |
| Above RM500,000 | 12,538 | 14,547.45 |
| Total | 32,313 | 19,861.93 |
| Price Range | Terrace | Semi Detach | Detach | High Rise | Low Cost | Others | Total |
|---|---|---|---|---|---|---|---|
| Below RM150,000 | 2,101 | 291 | 0 | 2,754 | 1,459 | 279 | 6,884 |
| RM151,000 - RM300,000 | 11,932 | 614 | 116 | 14,486 | 0 | 399 | 27,547 |
| RM301,000 - RM500,000 | 8,735 | 1,633 | 344 | 10,347 | 0 | 679 | 21,738 |
| RM501,000 - RM1,000,000 | 6,007 | 1,772 | 508 | 10,958 | 0 | 921 | 20,166 |
| > RM1,000,000 | 809 | 1,504 | 411 | 1,591 | 0 | 34 | 4,349 |
| Total | 29,584 | 5,814 | 1,379 | 40,136 | 1,459 | 2,312 | 80,684 |
| Percentage | 36.67% | 7.21% | 1.71% | 49.74% | 1.81% | 2.87% | 100.00% |
| Price Range | Terrace | Semi Detach | Detach | High Rise | Low Cost | Others | Total |
|---|---|---|---|---|---|---|---|
| < RM150,000 | 303 | 393 | 0 | 240 | 240 | 0 | 1,176 |
| RM151,000 - RM300,000 | 2,353 | 387 | 0 | 8,410 | 0 | 101 | 11,251 |
| RM301,000 - RM500,000 | 315 | 199 | 260 | 2,405 | 0 | 0 | 3,179 |
| RM501,000 - RM1,000,000 | 416 | 286 | 0 | 2,753 | 0 | 32 | 3,487 |
| > RM1,000,000 | 86 | 86 | 22 | 354 | 0 | 224 | 772 |
| Total | 3,473 | 1,351 | 282 | 14,162 | 240 | 357 | 19,865 |
| Percentange | 17.48% | 6.80% | 1.42% | 71.29% | 1.21% | 1.80% | 100.00% |
Trend of Malaysia Residential Property Overhang year on year from Y2014 in term of number of unit and value RM(million).
Residential Property Overhang Statistics for Y2018
Debt Service Ratio (DSR) is a way for banks to determine whether you are eligible to get a property loan from them.
DSR formula as follows:
| DSR = Commitment / Net Income. |
Net income is your gross income after deducting EPF and income tax portion.
| Income | Bank maximum allowable DSR |
|---|---|
| < RM3000 | 60% of Net Income |
| < RM6000 | 70% of Net Income |
| < RM10,000 | 75% of Net Income |
| > RM10,000 | 80% of Net Income |
Notes: Different banks have their own allowable DSR. Above table as guideline only.
For new loan application the DSR is calculated the same for all banks but for refinancing the DSR is calculated differently.
Let say:
Monthly Income:
Gross Income: RM10,000
EPF Deduction: RM1,000
Income Tax Deduction: RM1,000
Net Income: RM8,000
Monthly Commitment:
Credit Card: RM200
PTPTN: RM100
ASB Loan: RM200
Personal Loan: RM500
Car Installment: RM1,000
Total Commitment:RM2,000
| DSR (without new property loan) = RM2,000 / RM8,000 = 25% |
Assuming you apply new property loan with monthly installment of RM2,000.
So the DSR would be:
| DSR (with the new property loan) = RM4,000 / RM8,000= 50%. |
Based on the table allowable DSR, you are still eligible to apply for the housing loan.
Most bank will use similar DSR calculation as the new loan except for Maybank. According to Maybank for the cash out portion they would calculate based maximum tenure of 10 years and the original amount can go to maximum tenure either 30 years or maximum age of 70 years old.
The cash out calculation is only for DSR calculation but if Maybank approves the refinance, you still pay your monthly installment based on maximum tenure.
Calculation Example:
Outstanding amount of the original loan: RM100,000
Refinancing loan amount: RM200,000
So cash out = RM200,000 – RM100,000 = RM100,000
New Refinancing loan interest: 5%
The cash out monthly is calculated on RM100,000 based on 5% interest for 10 years which come to: RM1,061
While the outstanding amount of RM100,000 will be calculated based on 5% interest and tenure of 30 years which come to: RM536
So the monthly loan amount for DSR calculation is RM1,597
| DSR (for Maybank) = (RM1,597 + RM2,000) / RM8,000 = 45% |
Other banks will calculate RM200,000 based on 5% interest for 30 years which come to: RM1,074
| DSR (other banks) = (RM1,074 + RM2,000) / RM8,000 = 38% |
So other banks give lower DSR so easier to qualify for a loan. However usually, Maybank gives lower interest rate.
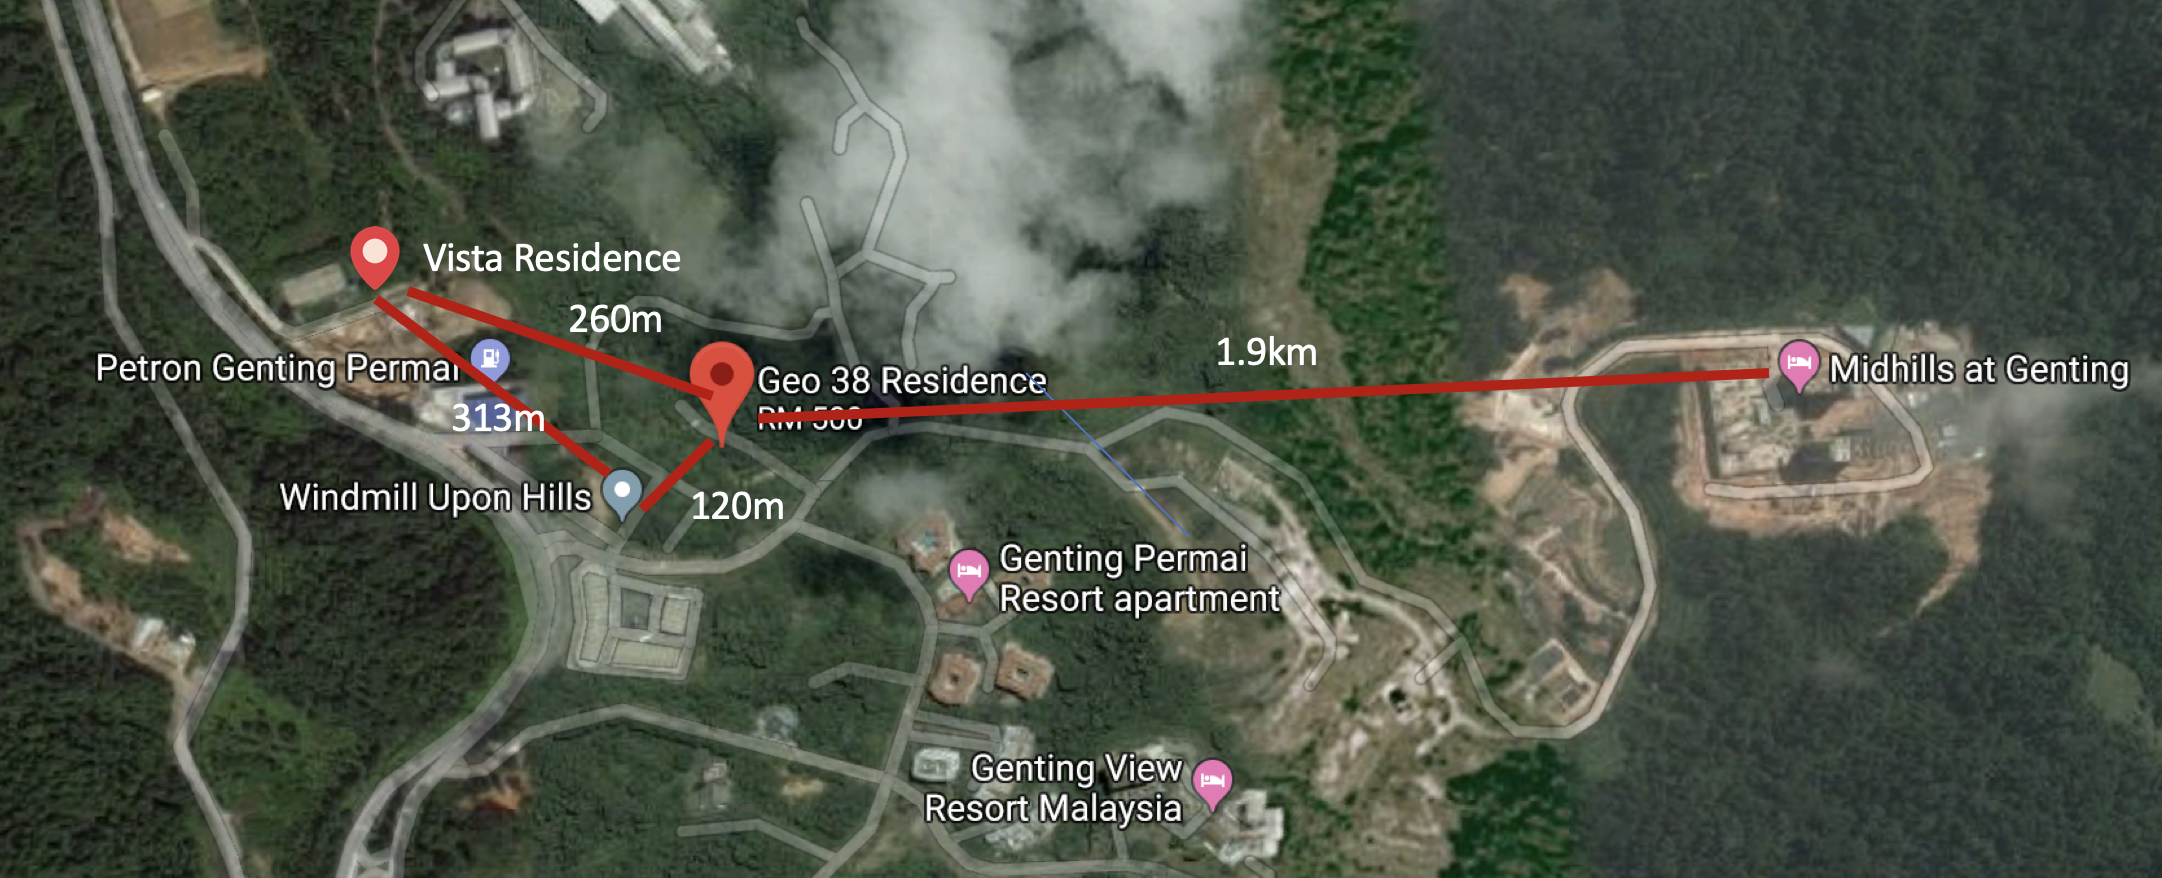
Thanks to the Genting Integrated Tourism Plan (GITP) plan, especially the expected 20th Century Fox Theme Park (now cancelled), 5 new condominium being constructed and completed at Genting Highlands. It actual location is at Genting Permai.
The new condominium are:
I would like to do analysis on the first 4 condominium as they are nearer to each other. Which condo is the best to invest in? What unique value the condo can offer vs its competitor?


| Features \ Condominum | Windmill Upon Hills | Vista Residence | Geo 38 Residence | Midhills |
|---|---|---|---|---|
| Type | Serviced Apartment | Serviced Residence | Condominium | Serviced Residence |
| Land Area | 5.57 acres | 1.33 acres | 3.80 acres | 5.35 acres |
| Tenure | Freehold | Leasehold | Freehold | Leasehold |
| Land Title | Commercial | Residential | Residential | Commercial |
| Price Range | RM492,000 - RM1,685,000 | RM889,350 - RM3,442,537 | RM408,528 - RM1,873,281 | RM495,000 - RM2,247,437 |
| Size Range | 362 sqft - 1,523 sqft | 844 sqft - 3,144 sqft | 642 sqft - 3,038 sqft | 557 sqft - 2,450 sqft |
| Price per sqft Range | RM1,359 per sqft - RM1,106 per sqft | RM1,053 per sqft - RM1,095 per sqft | RM636 per sqft - RM616 per sqft | RM889 per sqft - RM917 per sqft |
| Maintenance Fee & Sinking Fund | RM0.40 per sqft inclusive sinking fund | RM0.30 per sqft + 10% sinking fund | ? | ? |
| Completion Date | July 2019 | July 2018 | July 2019 | November 2017 |
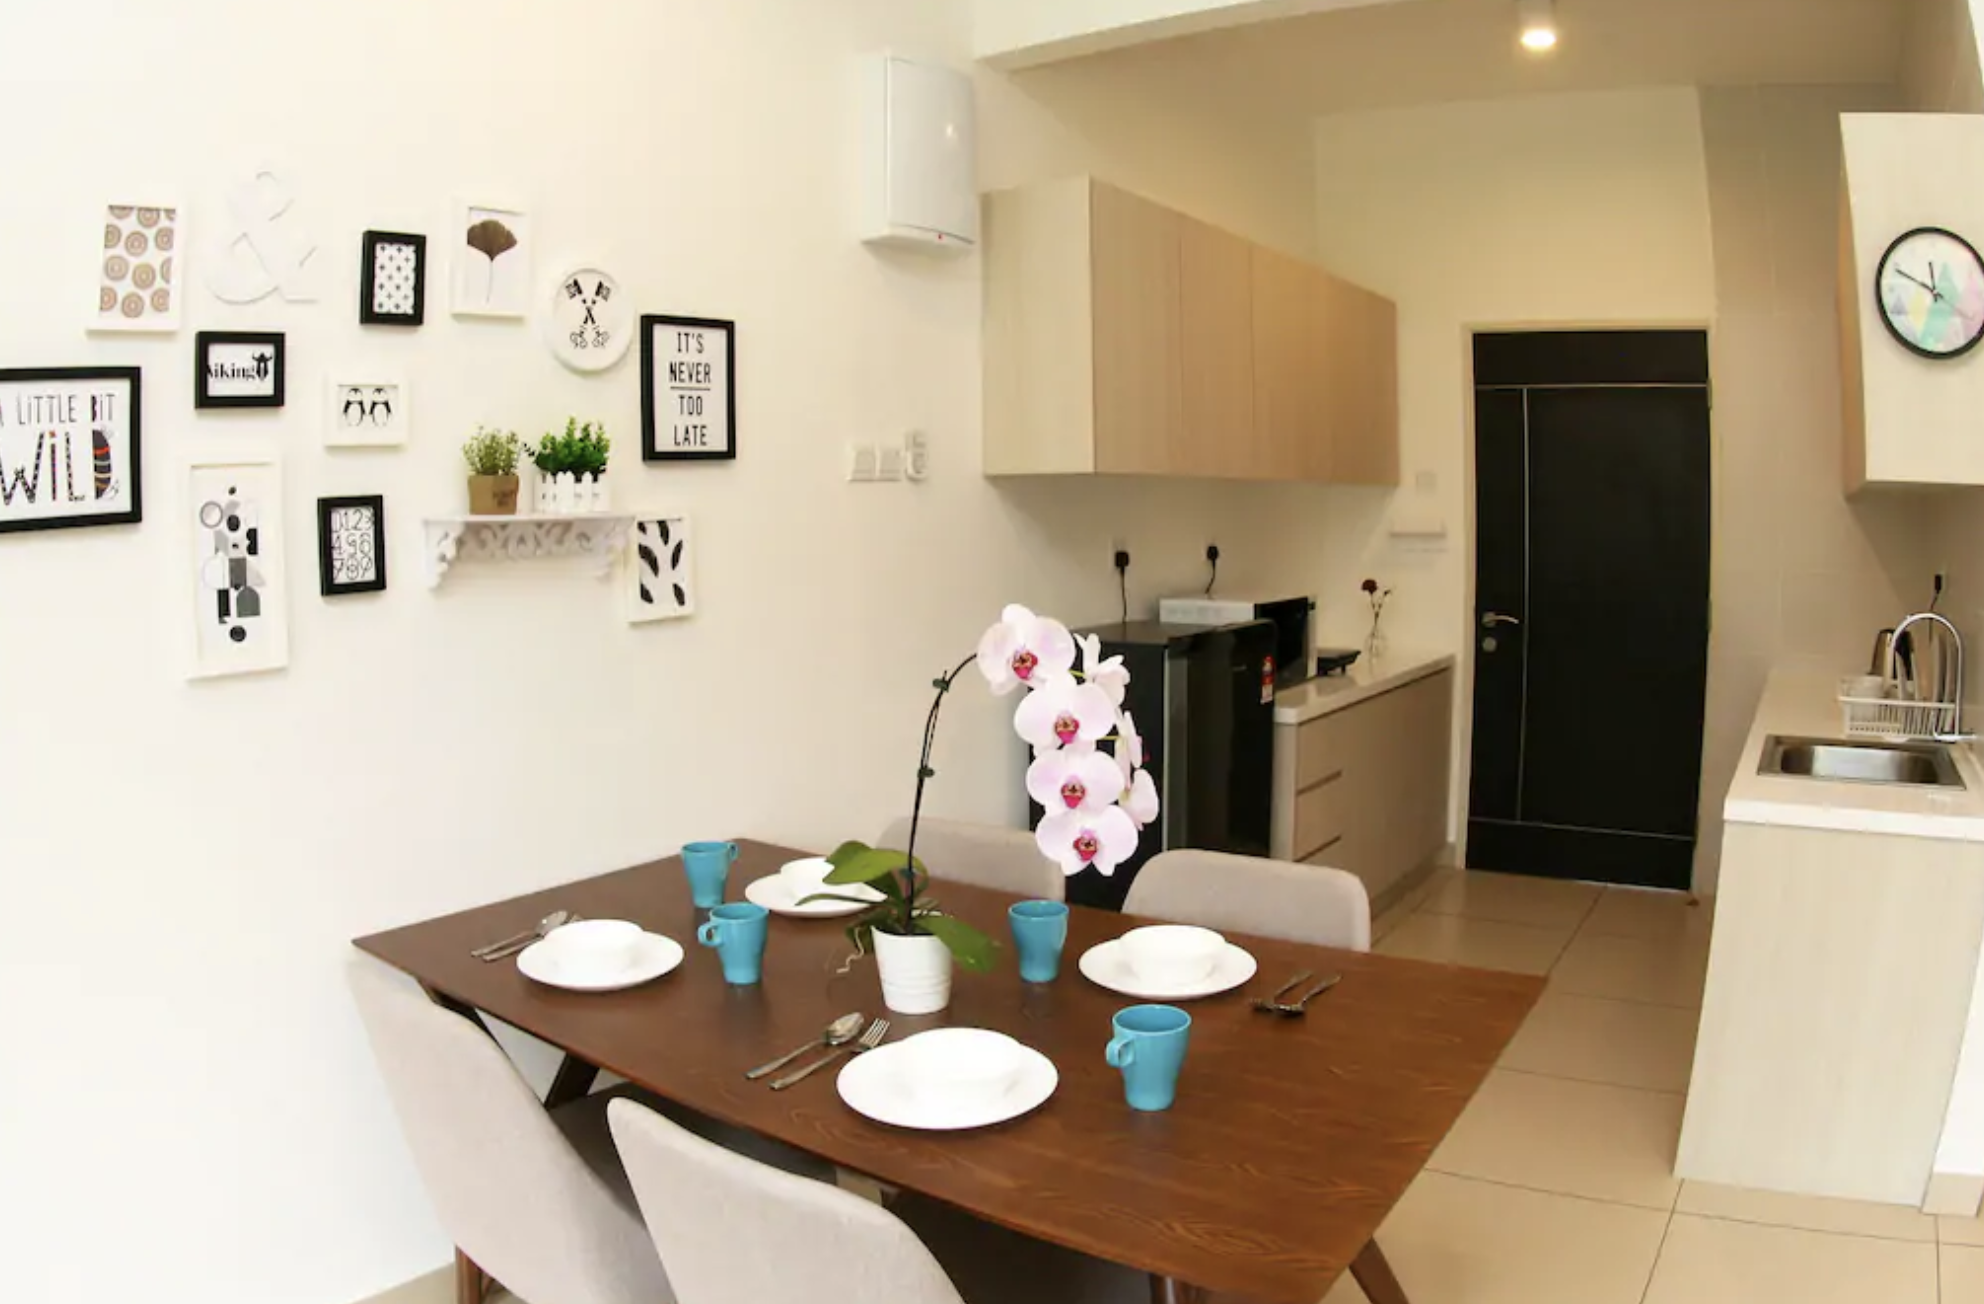
| Furnishing | Fully Furnished | Fully Furnished | ? | ? |
| Location | 3.386096, 101.774789 | 3.388038, 101.772729 | 3.388104, 101.774780 | 3.387214, 101.784745 |
| Developer | OSK Properties Sdn Bhd | Fututech Bhd | Pesat Bumi Sdn Bhd | LBS Bina |
| Number of Blocks | 4 | ? | 1 | 3 |
| Number of Levels | 42 Level for Tower A, B and C and 32 Levels for Tower D | 33. (1 level Facilities + 23 level Service Residential + 3 level Shoplots + 6 level Carparks) | 38 | 19 |
| Number of Units | 1,108 | 378 | 579 | 610 |
| Tower A (266 units), B(267 units), C(262 units) and D(313 units) | 378 units of Serviced Apartment 31 units of Retail Lots + 11 kiosk | Tower 1 - 192 units Tower 2 - 251 units Tower 3 - 167 units |
||
| Website | Link | Link | Link | Link |
| Facilities | ||||
| Garden | Yes | Yes | Yes | Yes |
| Gym | Yes | Yes | Yes | Yes |
| Swimming Pool | Heated Lap Pool & Kids Pool | Heated Pool | Swimming pool & Kids pool | Lap pool, Family pool & wading pool |
| Jacuzzi | Yes | Yes | Yes | Yes |
| Sauna | Yes | Yes | Yes | No |
| Spa | Yes | No | No | No |
| Children Playground | Yes | Yes | Yes | Yes |
| Jogging Track | Yes | No | Yes | No |
| Barbecue Area | Yes | Yes | Yes | Yes |
| Squash Court | Yes | No | No | No |
| Tennis Court | Yes | No | Yes | No |
| Games Room | Yes | No | Yes | Yes. Foosball, pool table, chess, dart, carrom & table tennis |
| Multipurpose Hall | Yes | Yes | Yes | No |
| Convenient Shop | No | Yes | Yes | No |
| Other Facilities | Sky Deck Sunken Deck Celebration Alcove Changing Room Reflexology Path Parcouse Brooks & Bridges | Private-owned roof-top sky-lounge | Sky Garden and Multi Tier Security with Access Card Laundrette TaiChi/Yoga Deck/Reflexology Path Exercise Pole Park AV/Entertainment Room Library Kindergarden Meeting Room | Aqua Wall Reading Nook Waterlily Pond Hammock Deck Reading Room Kick Boxing Spin Cup Fun Zone Air Hockey TV Room Kiddy Bowling Chilled Out Area Sky Aerobic Yoga Deck Hopscotch Social Corner Reflexology Path Reflection Corner Gazebo Zen Deck Aqua Deck Open Air Messamine Fitness Station The Plaza |
When choosing a property, we also must evaluate its developer as it will tell whether you will get quality workmanship, deliver on time and as advertised. To evaluate that I compare based on The Edge Property Excellence Award (as it is easy to find info and the award relates on property quality as well).
Besides I try to find the developers QClassic Scoring. Unfortunately not easy to find information for the correspondent developers.
The Edge Property Excellence Award (TEPEA) is an award given to property developers based on their quantitative attributes:
and its qualitative attributes as follows:
| Developer | TEPEA 2018 | TEPEA 2017 | TEPEA 2016 |
|---|---|---|---|
| OSK | 14 | 16 | 18 |
| Kerjaya Prospek | N/A | N/A | N/A |
| Pesat Bumi | N/A | N/A | N/A |
| LBS | 19 | 24 | N/A |
Quality Assessment System in Construction (QLASSIC) is a system or method to measure and evaluate the workmanship quality of a building construction work based on Construction Industry Standard (CIS 7). QLASSIC enables the quality of workmanship between construction projects to be objectively compared through a scoring system.
The accreditation is done by CIBD.
So far I can only find OSK QClassic for Emira Shah Alam Project scored at 80.28%. It means that OSK already doing QClassic to ensure that their property development follows high standard.
| Windmill Upon Hills | Vista Residence | Geo 38 Residence | Midhills | |
|---|---|---|---|---|
| Location | 1.0 | 1.0 | 1.0 | 1.0 |
| More Facilities | 1.1 | 0.5 | 1.0 | 1.5 |
| Less Density | 0.6 | 1.8 | 1.2 | 1.1 |
| Less Price per sqft | 0.7 | 0.9 | 1.5 | 1.0 |
| Total | 3.4 | 4.2 | 4.7 | 4.5 |
*The higher the scores, the better it is.
The best condo is Geo 38 Residence while Windmill Upon Hills scored the lowest.
Windmill Upon Hills has good facilities but more dense and more expensive.
Vista Residence has less facilities.
Geo 38 Residence has good facilities, most affordable pricing among other condos.
Midhills is less dense and has good facilities.
Windmill Upon Hills Price Min & Max
Vista Residences Price Min & Max
Geo 38 Residence Price Min & Max
Midhills Price Min & Max
I want to refinance one of my properties. I want to know what is the differential interest rate that worth it for me to refinance. I read few articles some articles suggest to refinance if the interest difference is 2%. But sometime it is acceptable if 1%.
Without getting firm rules of thumb from reading few articles. I decided to calculate myself what would be the good rules of thumb to refinance mortgage.
First let say what would be possible reasons to refinance.
In my case, I want to cash out and use the money for investment. My intention is to park the cash out money into ASB (Amanah Saham Bumiputra) earning yearly dividend of 7%.
Below is the scenario that I use to do my analysis.
Initial Loan Amount (Before Refinance): RM100,000
Loan Tenure: 30 years
Interest Rate: 5.35%
Monthly Payment: RM558

When refinance, there will be cost as follows:-


Interest Difference
The difference between the current loan interest rate vs the refinancing loan @ new loan.
Effective Rate
Interest of the refinancing loan.
Tenure (years)
In the analysis, I use the remaining 20 years to refinance the previous loan balance.
Monthly Installment
The monthly payment for the refinancing loan.
Total Interest Paid
Total interest paid for the refinancing loan over 20 years of tenure
Total Saving Over Tenure
Total saving from reduction of interest paid (the difference between previous loan vs refinancing loan) plus total monthly installment save from the previous loan vs refinancing loan over 20 years of tenure.
Net Saving
Total Saving Over Tenure minus out the refinancing cost.
CAGR Net Saving / Financing Cost
CAGR is over 20 years. The bigger the number the better.
Opportunity Lost @ 7%
By how much the refinancing cost will grow by putting it into ASB and earning 7% per year over 20 years.
The acceptable return is when the interest difference is 1.25% as CAGR is 6.60% and Total Saving / Opportunity Lost is 113.70% means total saving can cover the refinancing cost with dividend 0f 7%.
Important to notes even at 1% interest difference the CAGR is at 5.16% and Total Saving / Opportunity Lost is 92.43% which I think is commendable return.
References:
Excel used to calculate, you can download and do your own conclusion.
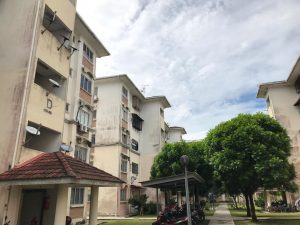
Palma Puteri Apartment is medium cost apartment located in Kota Damansara. It is a leasehold property expired by 24/07/2106. The tenure is 99 years.
This leasehold information is important if you want to sell or refinance your property.